ROAS Is Lying to You: What the Platform Number Is Hiding About Your Margins
A 4x ROAS can mean profit for one brand and a loss for another. Here's how platform ROAS, blended ROAS, and true profitability actually differ.
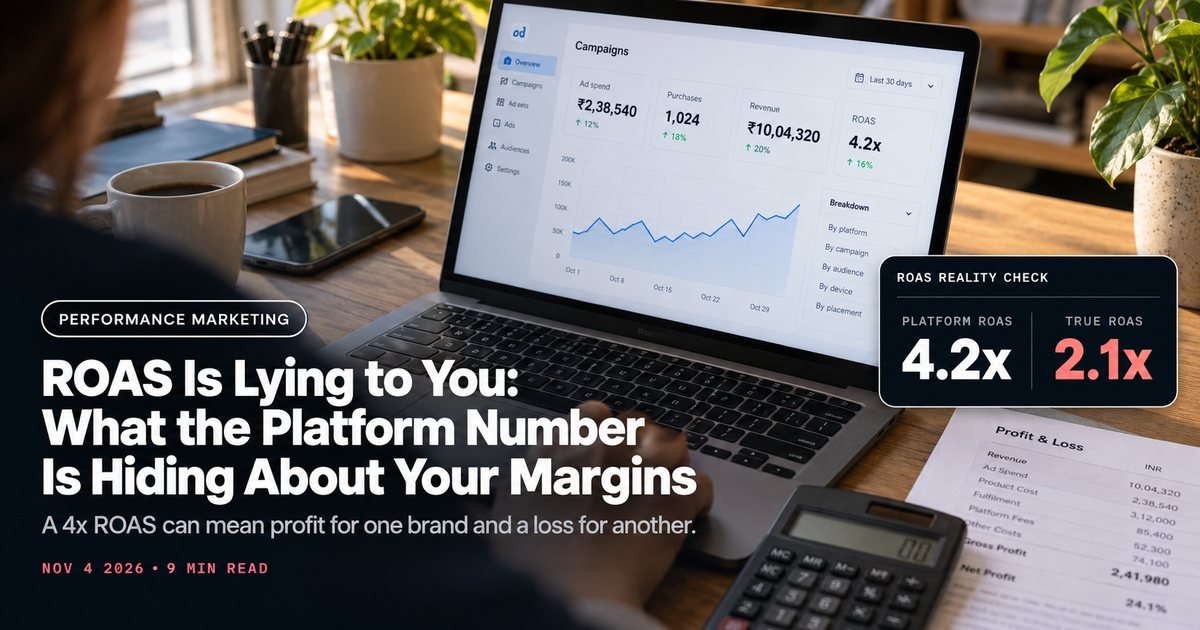
A founder messaged us last month, genuinely confused, asking why their agency kept celebrating a 4x ROAS while the bank balance kept shrinking. The ads were "working." The business wasn't. That's the trap.
That gap is the whole problem with how most people talk about roas marketing. Return on ad spend is a real, useful number. It is also, by itself, almost meaningless for deciding whether a campaign made the business money.
This isn't an argument against ROAS, but an argument for knowing which of the three different numbers people call "ROAS" you're actually looking at, because they tell wildly different stories.
The number Meta and Google show you isn't the number that matters
Platform-reported ROAS, the figure sitting in your Ads Manager or Google Ads dashboard, measures ad spend against the revenue the platform attributes to that spend. It's calculated inside a walled garden, using the platform's own attribution model, usually a 7-day click or 1-day view window by default on Meta.
That attribution model is generous to itself. Too generous, usually. It credits the platform for conversions that might have happened anyway, counts view-through "conversions" from someone who never clicked, and ignores every other channel that touched the customer along the way.
A platform-reported 5x ROAS is a statement about the platform's attribution logic, not a statement about your bank account. It's not fabricated, it's just measuring a narrower thing than most people assume when they read the number.

Blended ROAS gets you one step closer, but not all the way
Blended ROAS fixes the attribution-overcounting problem by comparing total ad spend across all channels against total store revenue, using your actual order data instead of each platform's self-reported number.
If Meta claims 5x and Google claims 4x but your total ad spend across both is ₹10 lakh and total revenue for the period is ₹35 lakh, your real blended ROAS is 3.5x, not the inflated sum the platforms would suggest if you added their self-reported numbers together.
This is a meaningfully better number, and any performance marketing setup worth paying for should be reporting blended ROAS alongside platform numbers rather than in place of them, since it strips out the double-counting that happens when the same sale gets credited by two different platforms.
But blended ROAS still has a hole in it, because revenue and profit are different things. A ₹35 lakh month on 3.5x blended ROAS tells you nothing about whether that revenue made money once you account for what it actually cost to deliver.
True profitability is the number that actually decides if you survive
This is where most ROAS conversations stop short, and it's the number that actually matters for a D2C brand's survival: ROAS after cost of goods sold, shipping, payment gateway fees, and returns.
Take a real example. Numbers help here. A skincare brand sells a ₹999 serum. COGS runs ₹280. Shipping (reverse logistics included, since COD returns are common) averages ₹90 per order. Payment gateway and COD collection fees run roughly ₹35. Returns and refunds eat another 8% of orders entirely, meaning roughly 8% of "revenue" never actually lands.
Platform-reported ROAS on this product might show 4x, which looks excellent. But once COGS, shipping, fees, and returns are subtracted, the real contribution margin per order might be closer to ₹450, well under the full ₹999.
A 4x platform ROAS on that ₹999 order, spending ₹250 on ads, looks like ₹749 of profit at first glance. After real costs, the true number is closer to ₹200. A very different business.
The gap between platform ROAS and true profitability is almost always bigger than founders expect, especially in categories with high COD return rates or thin product margins.
Why "a good ROAS" varies so much by category
This is why there's no universal "good ROAS" number, despite how often that question gets asked. A category with 70% gross margin (many supplements, some beauty) can profitably run at a 2x ROAS. A category with 30% gross margin (some fashion, most grocery-adjacent products) needs 4x or higher just to break even on ads.

Shipping costs matter too. A lightweight, low-return product (a supplement bottle, a small accessory) carries much lower fulfillment cost per order than a heavy or high-return product (apparel with size issues, furniture, anything fragile). Two brands can run identical 3x platform ROAS and one is comfortably profitable while the other is losing money on every order.
COD mix changes the math again. A brand running 60% COD typically eats a higher return rate (customers refuse delivery more easily than they'd cancel a prepaid order) plus COD collection fees on top. That same 3x ROAS needs to clear a higher bar to be genuinely profitable than it would for a prepaid-only brand.
Calculating your own realistic target ROAS
Skip the generic "aim for 3x" advice and work out your actual breakeven number instead. It takes about twenty minutes with real numbers from your own P&L:
- 1Start with your average order value (AOV).
- 2Subtract COGS for that order (the actual landed cost of the product).
- 3Subtract average shipping cost per order, including reverse logistics if your return rate is meaningful.
- 4Subtract payment gateway or COD collection fees (typically 2-3% for prepaid, more for COD collection).
- 5Multiply the result by your delivery success rate (1 minus your return/RTO rate) to get expected contribution margin per attempted order.
- 6Divide AOV by that contribution margin figure. That ratio is your breakeven ROAS, the minimum platform-reported ROAS needed just to cover costs, before any profit.
A brand with a ₹999 AOV, ₹450 landed contribution margin, and a 90% delivery success rate needs roughly a 2.2x ROAS just to break even on unit economics (ignoring fixed costs like salaries and tooling, which need their own margin on top). Anything your account reports above that breakeven line is genuine contribution to profit.
This is also the number worth comparing against when you're evaluating a performance marketing agency's cost and promised results, since "we get clients a 5x ROAS" means nothing without knowing the margin structure behind it.
What to actually report and track
Track all three numbers, not just one, and label them clearly so nobody on the team confuses them:
Platform ROAS, for diagnosing individual campaign and creative performance inside each channel. Blended ROAS, for understanding total paid media efficiency across the whole account. True contribution margin ROAS, for deciding whether the business is actually making money, and the only one that should inform decisions about scaling spend aggressively.
Report blended ROAS and true profitability side by side every month instead of platform ROAS alone. A campaign can look like a win on one number and a loss on another, and that gap is exactly the information you need to catch early.
This same discipline matters when evaluating whether to lean harder into paid or shift budget toward content marketing and organic channels that carry no incremental ad spend at all. The decision only makes sense once you know your true number rather than the platform's number.
A quick worked example, start to finish
Take a fictional but realistic apparel brand to see all three numbers side by side. Meta reports a 4.2x ROAS for the month. Google reports 3.8x. Add those together naively and it looks like the brand is crushing it across both channels.
Pull real order data instead and total ad spend across both platforms comes to ₹8 lakh against ₹28 lakh in actual revenue for the period, a blended ROAS of 3.5x, lower than either platform's self-reported number because some conversions were being double-counted across the two.
Now apply the margin math. AOV is ₹1,450. COGS for apparel at this brand runs ₹520. Shipping and reverse logistics average ₹140 given a 22% return rate typical of fashion. Payment and COD fees take another ₹45. Contribution margin per successful order lands around ₹745, and the delivery success rate (after returns) is 78%.
Breakeven ROAS for this brand works out to roughly 1.9x. A 3.5x blended ROAS is comfortably above that line, meaning the brand is genuinely profitable on ads, not just busy.
But if the same brand's return rate crept up to 35%, a common risk with fashion sizing issues, that breakeven number shifts closer to 2.6x, and the gap to the actual blended ROAS shrinks fast. The arithmetic moves the moment any one input moves. Recalculate it, don't assume it.
Want us to audit where your CAC is leaking?
Book a call