What's a Good Conversion Rate for a D2C Ecommerce Store in India? (2026 Benchmarks)
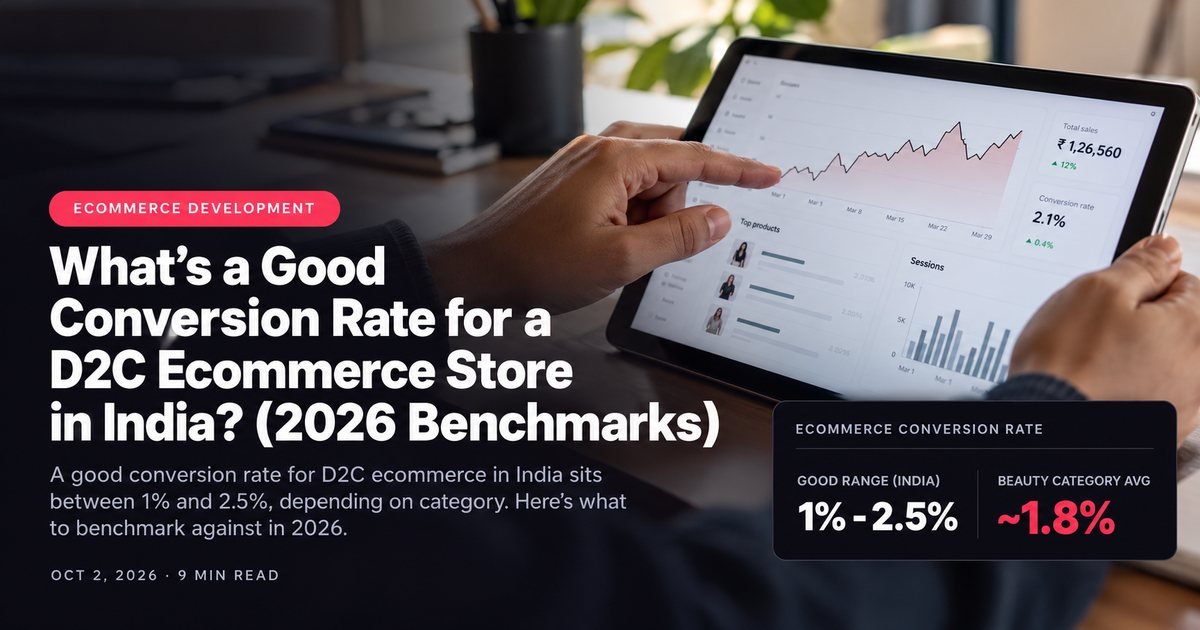
A good conversion rate for D2C ecommerce in India sits between 1% and 2.5%, depending on category. Here's what to benchmark against in 2026.
Every founder asks the same question after checking Shopify analytics: is my conversion rate actually good, or am I fooling myself?
The honest answer depends on what you sell. A skincare brand converting at 1.8% might be crushing it. A fashion label at the same 1.8% could be leaving money on the table. Category matters more than most dashboards let on.
This post gives you real, category-split benchmarks for Indian D2C stores in 2026, so you can stop comparing your store to a generic "2-3% is good" rule that doesn't fit your business. If the store itself is the bottleneck rather than the traffic, our ecommerce development team can tell you which within a day.
We pulled these ranges from patterns across client accounts and cross-checked them against public merchant data. They won't line up with your exact store to the decimal point, but they'll show you which range to actually aim for instead of chasing a number that never applied to you.
Why one flat number doesn't work
Most conversion rate advice online quotes a single global average, usually somewhere around 2-3%. That number is a blend of every category, every price point, every traffic source on earth.
It tells you almost nothing about your specific store. A ₹499 lip tint and a ₹15,000 leather jacket do not convert at the same rate, and they shouldn't.
Neither do a first-time visitor from a cold Instagram ad and a returning customer who typed your URL directly and already knows your sizing. Lumping them together produces a number that describes nobody's actual business.
Benchmarks only mean something when you split by category, traffic source, and device. Anything less specific is a vanity number.

Category benchmarks for Indian D2C stores (2026 estimates)
These figures come from aggregate patterns we see across Indian D2C client accounts, cross-checked against public ecommerce benchmark reports (Shopify's own merchant data, Littledata, and industry surveys). They are estimates, not a single authoritative source. Treat the ranges as your working target, not gospel.
- Beauty and skincare: roughly 1.8% to 2.3% overall traffic conversion. Repeat-purchase-heavy brands with a subscription push can climb past 3%.
- Fashion and apparel: typically 1.0% to 1.5%. Size uncertainty and return anxiety pull this down versus other categories.
- Food and beverage, packaged rather than perishable: around 2.0% to 2.8%. Lower price points and habitual repurchase drive this up.
- Health and wellness, think supplements and personal care devices: 1.5% to 2.2%, with variance depending on how much education the product needs before someone buys.
- Home and lifestyle: 1.0% to 1.8%. Higher average order values mean longer consideration, which suppresses first-visit conversion.
Here's the pattern worth noticing: lower price point plus impulse-friendly category equals higher conversion rate. Higher consideration plus fit risk equals lower conversion rate, even with excellent marketing.
If your store sits meaningfully below its category range on desktop and mobile both, something in the funnel is broken, not just "needs more traffic."
Mobile vs desktop changes the picture
Indian D2C traffic is overwhelmingly mobile: 75-85% of sessions for most brands we work with. That single fact skews blended conversion rates lower than what a US or European benchmark table shows, because mobile converts worse than desktop almost everywhere.
Expect mobile conversion to run 20-40% lower than desktop for the same store and same traffic source. A brand converting at 1.2% blended might be doing 0.9% on mobile and 2.1% on desktop, and that split is completely normal.

Don't panic over a low blended number without checking the device split first. It changes what you fix.
Traffic source changes the benchmark too
Paid social traffic (Meta, Instagram) tends to convert lowest, often 0.8% to 1.5%, because it's cold demand you're creating, not capturing. Meta ads for D2C brands that look "underperforming" against a 2% benchmark are often performing fine for that channel.
Search traffic (Google, branded search) converts highest, frequently 3% to 6%, because the visitor already has intent. Email and SMS to your own list can run even higher, sometimes 8%+ for a warm list with a real offer.
Blending all three into one number and comparing it to a category average is the most common benchmarking mistake we see. Segment first, then benchmark.
What "needs fixing" actually looks like
A conversion rate that's low for its category and channel usually traces back to one of a few repeat offenders:
- 1Page load past 3 seconds on mobile, especially on the product page.
- 2No visible trust signals near the add-to-cart button, like returns policy, COD availability, or a visible reviews count.
- 3Checkout asking for more fields than needed before payment options appear.
- 4Product photography that doesn't answer the size, texture, or fit question a buyer actually has.
- 5No urgency or scarcity signal on a page where the product genuinely could sell out.
Most of these are fixable in weeks, not months.
None of them require a full site rebuild, though founders often assume "conversion problem" means starting over from scratch.
If you're seeing a rate meaningfully below your category range across both mobile and desktop, work through that checklist first. It's exactly what a proper CRO pass on your Shopify store walks through, page by page.
When your rate is fine and the problem is elsewhere
Sometimes a brand is sitting right at benchmark and still frustrated with revenue. Usually the real issue is traffic quality or average order value, not the conversion rate itself.
Check your funnel top before you touch your funnel bottom. If your ad targeting is pulling in low-intent clicks, no landing page fix will lift conversion, because the traffic itself doesn't want to buy yet.
This is where it helps to look at the broader state of Indian ecommerce heading into 2026: rising CPMs, tighter margins, and more competition for the same attention mean the traffic mix matters as much as the store itself.

New brands need a different lens
If your store launched in the last three to six months, don't panic over any of these ranges yet. New stores carry almost no trust signal: no review count, no repeat-customer base, no branded search volume feeding in cheap, high-intent traffic.
A brand new store often converts at half its eventual category benchmark for the first quarter, purely because trust hasn't been built yet. That's expected, not a red flag.
Track your trajectory, not just the absolute number. A new beauty brand moving from 0.8% to 1.4% over three months is on a healthy path even though 1.4% still sits below the 1.8-2.3% mature-brand range. What matters is the direction and the pace, not matching a benchmark meant for an established store on day 90.
Where this gets risky is when a founder sees a low number early on and starts throwing every possible fix at the site at once: new theme, new checkout app, rewritten product copy, all in the same week.
That makes it impossible to know what actually moved the needle. It usually creates new bugs faster than it fixes the real one.
A quick way to self-diagnose this week
Pull your last 30 days of data and split it three ways: by device, by traffic source, and by new vs returning visitor. Compare each slice to the category ranges above, not the blended number.
If you're within range on most slices but weak on one specific combination (say, mobile paid social for new visitors), that's a targeted fix, not a site-wide overhaul. If you're below range across the board, the issue sits in the store itself: speed, trust, or checkout friction.
Either way, you now have a real target instead of guessing whether "2%" means anything for your brand.
The takeaway
- 1Don't benchmark against a single global number. Use your category range: beauty ~1.8-2.3%, fashion ~1.0-1.5%, F&B ~2.0-2.8%, wellness ~1.5-2.2%, home ~1.0-1.8%.
- 2Split by device before you panic. Mobile runs 20-40% lower than desktop, and that's normal in India's mobile-heavy market.
- 3Split by traffic source before you compare. Paid social, search, and owned channels (email/SMS) don't convert the same, and shouldn't be judged the same.
- 4If you're below range everywhere, the fix is usually speed, trust signals, or checkout friction, not more ad spend.
- 5If you're at benchmark and still frustrated, the problem is traffic quality or order value, not the conversion rate itself.
If you want a second opinion on where your store actually sits, book a free strategy call and we'll walk through your numbers against your category's real range, not a generic industry average.
Book a call